Pulse
Analyse how your team works, from its git history and pull requests.
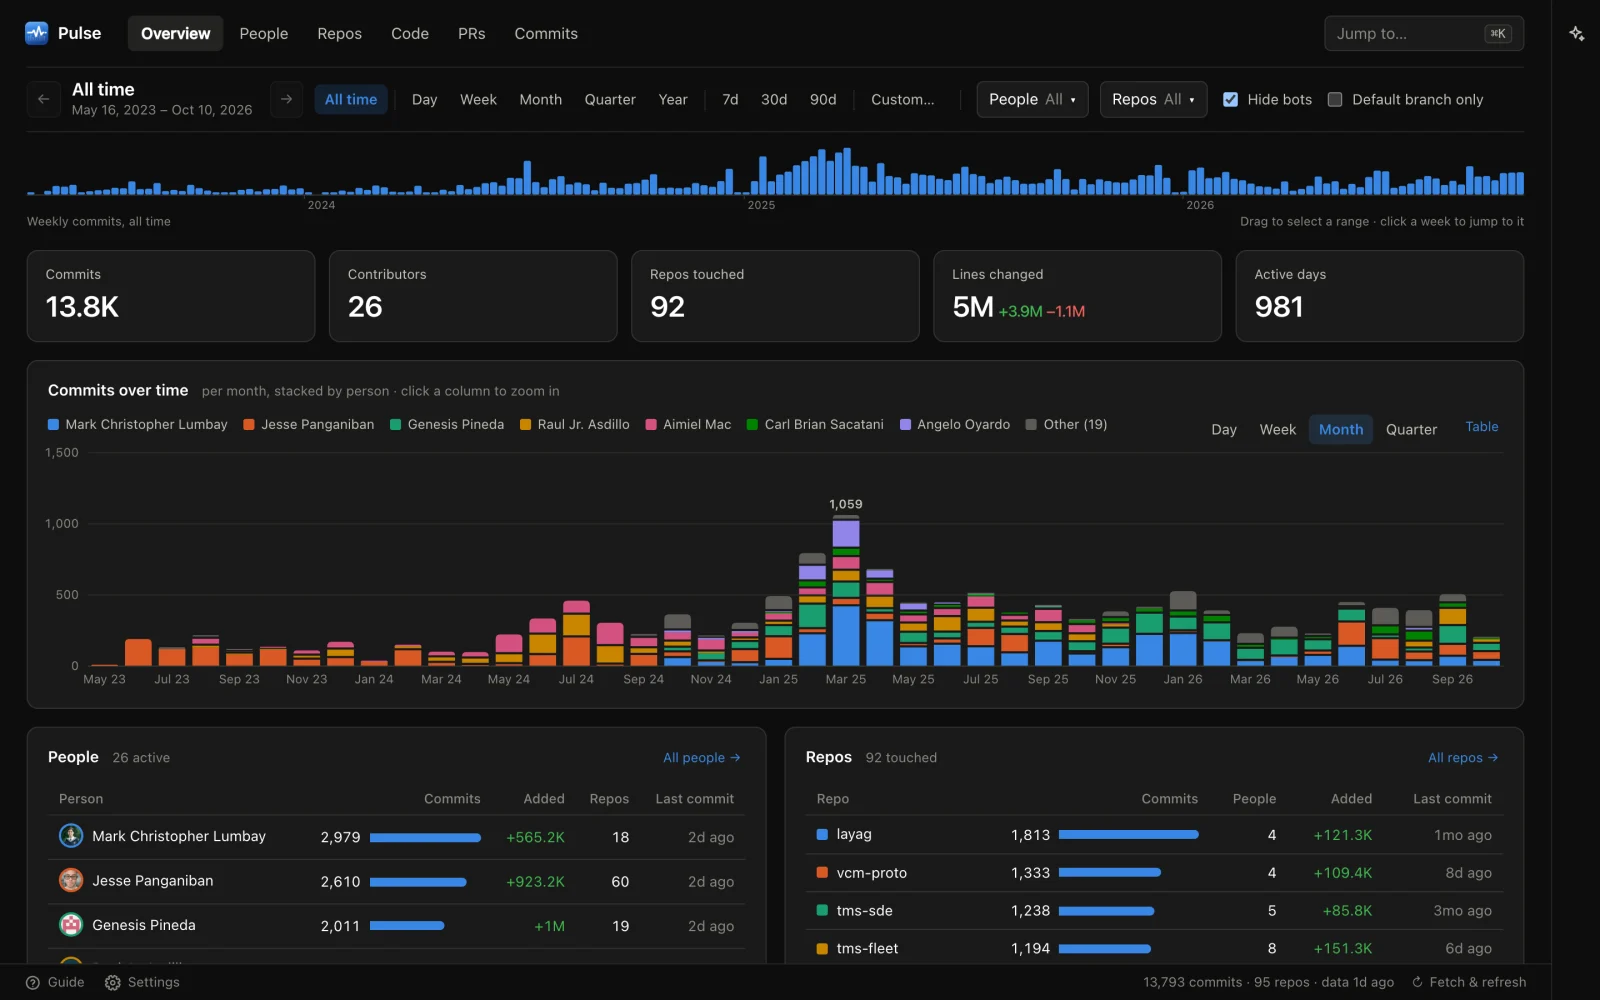
I built Pulse because I wanted a fair picture of my team’s work across the nearly hundred repositories at Sageware, without wiring up another dashboard service.
It reads the git history of every repository in a folder, and the pull requests and reviews from GitHub, and lets you look at any of it by person, by repository, or one person in one repository, for any day, week, month, quarter or year. The headline numbers are compared with the same point in the last period, so you can see whether things are moving.
People
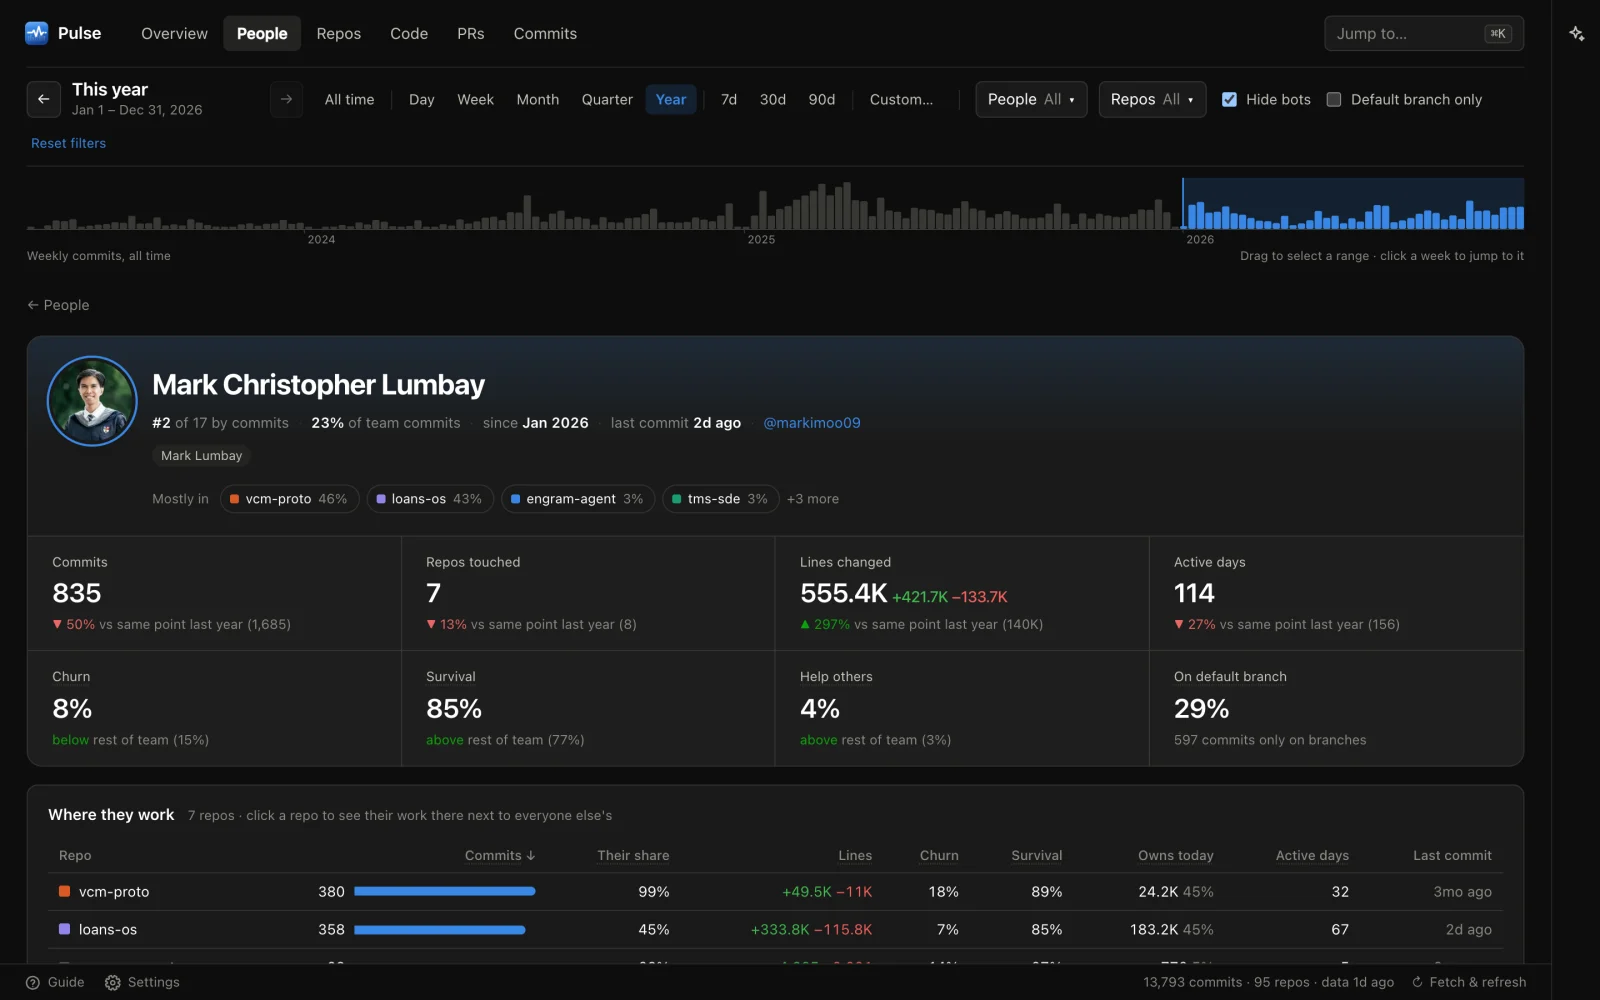
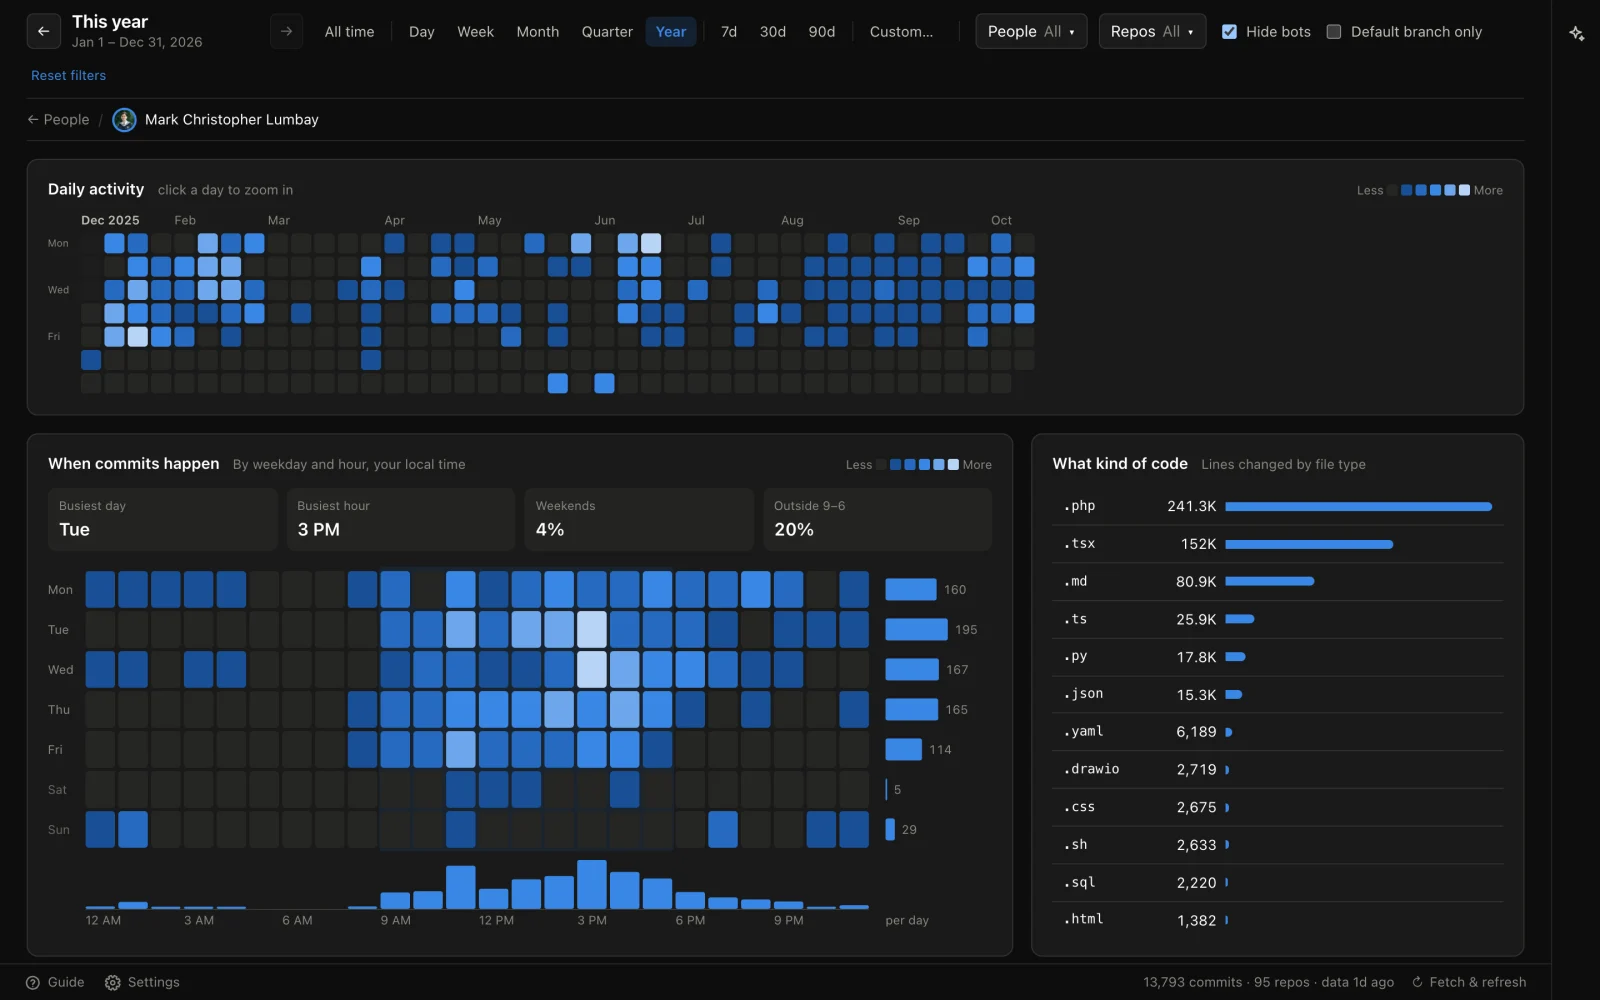
Each person gets a page: their rank and share of the team’s commits, where they work, and how their churn, survival and help to teammates compare with the rest of the team. A calendar shows every day they committed, and a punchcard shows when in the week they tend to work.
What kind of work it is
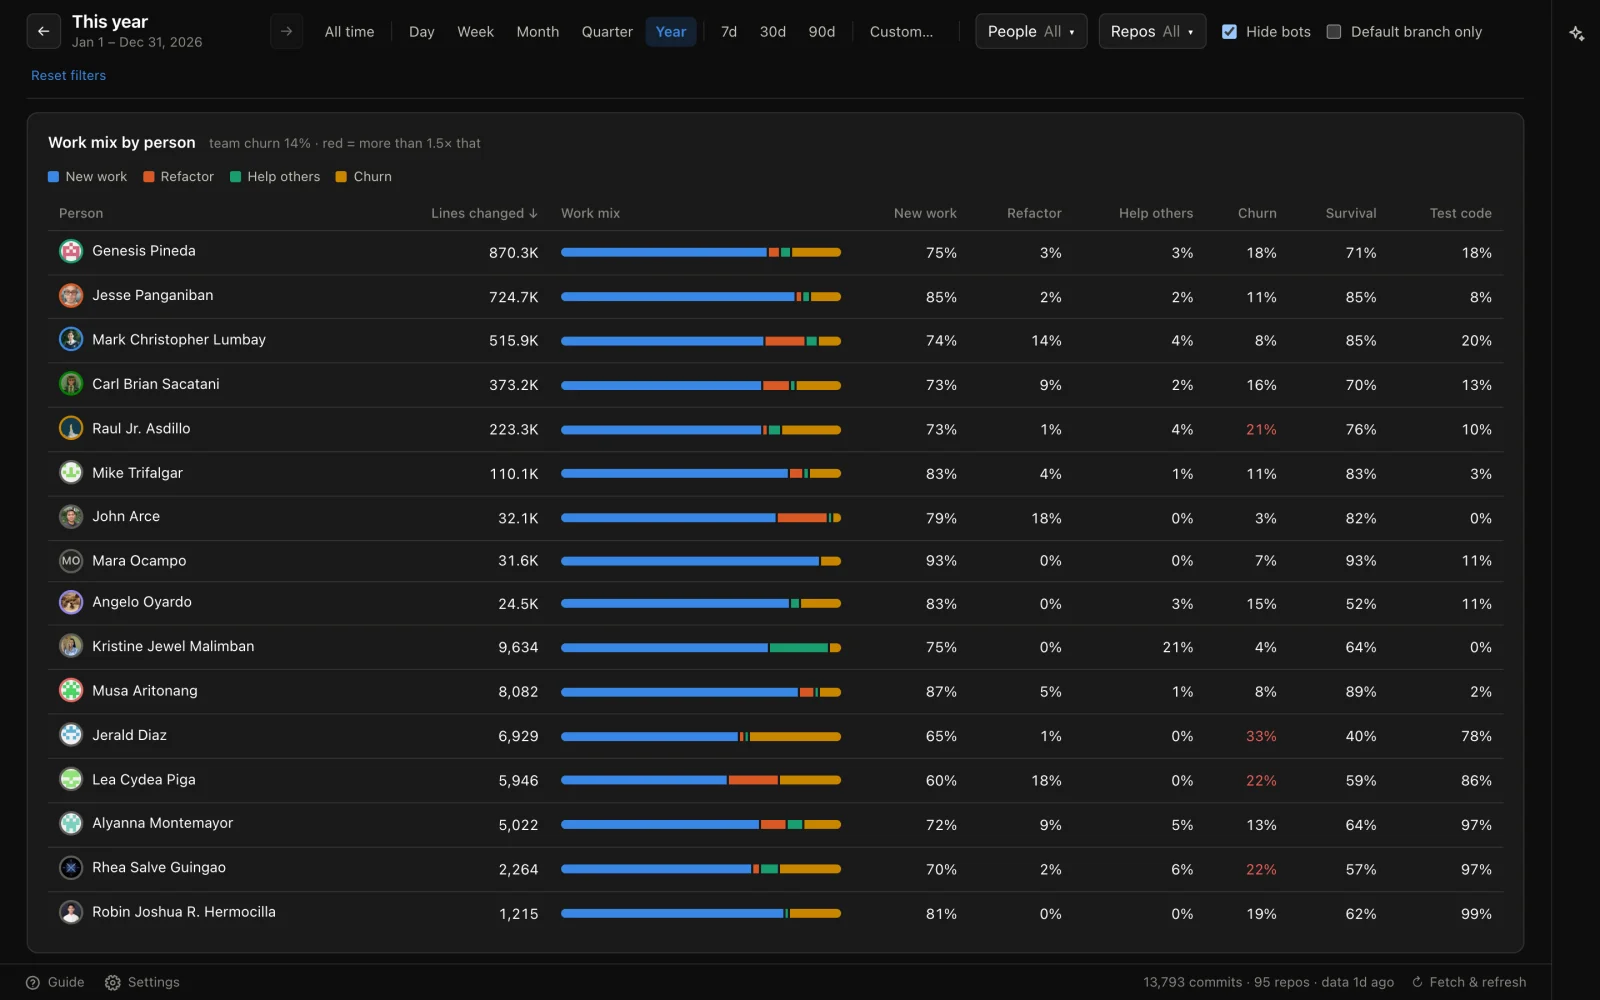
Pulse sorts every changed line into one of four kinds:
- New work: lines that weren’t there before.
- Refactoring: changes to code that has settled, more than three weeks old.
- Churn: someone reworking their own code from the last three weeks.
- Helping others: someone improving a teammate’s recent code.
It estimates this by tracking who wrote each recent line and how old it is, following files through renames. Lockfiles, build output and other generated files are left out so they don’t drown the signal.
Code that lasts
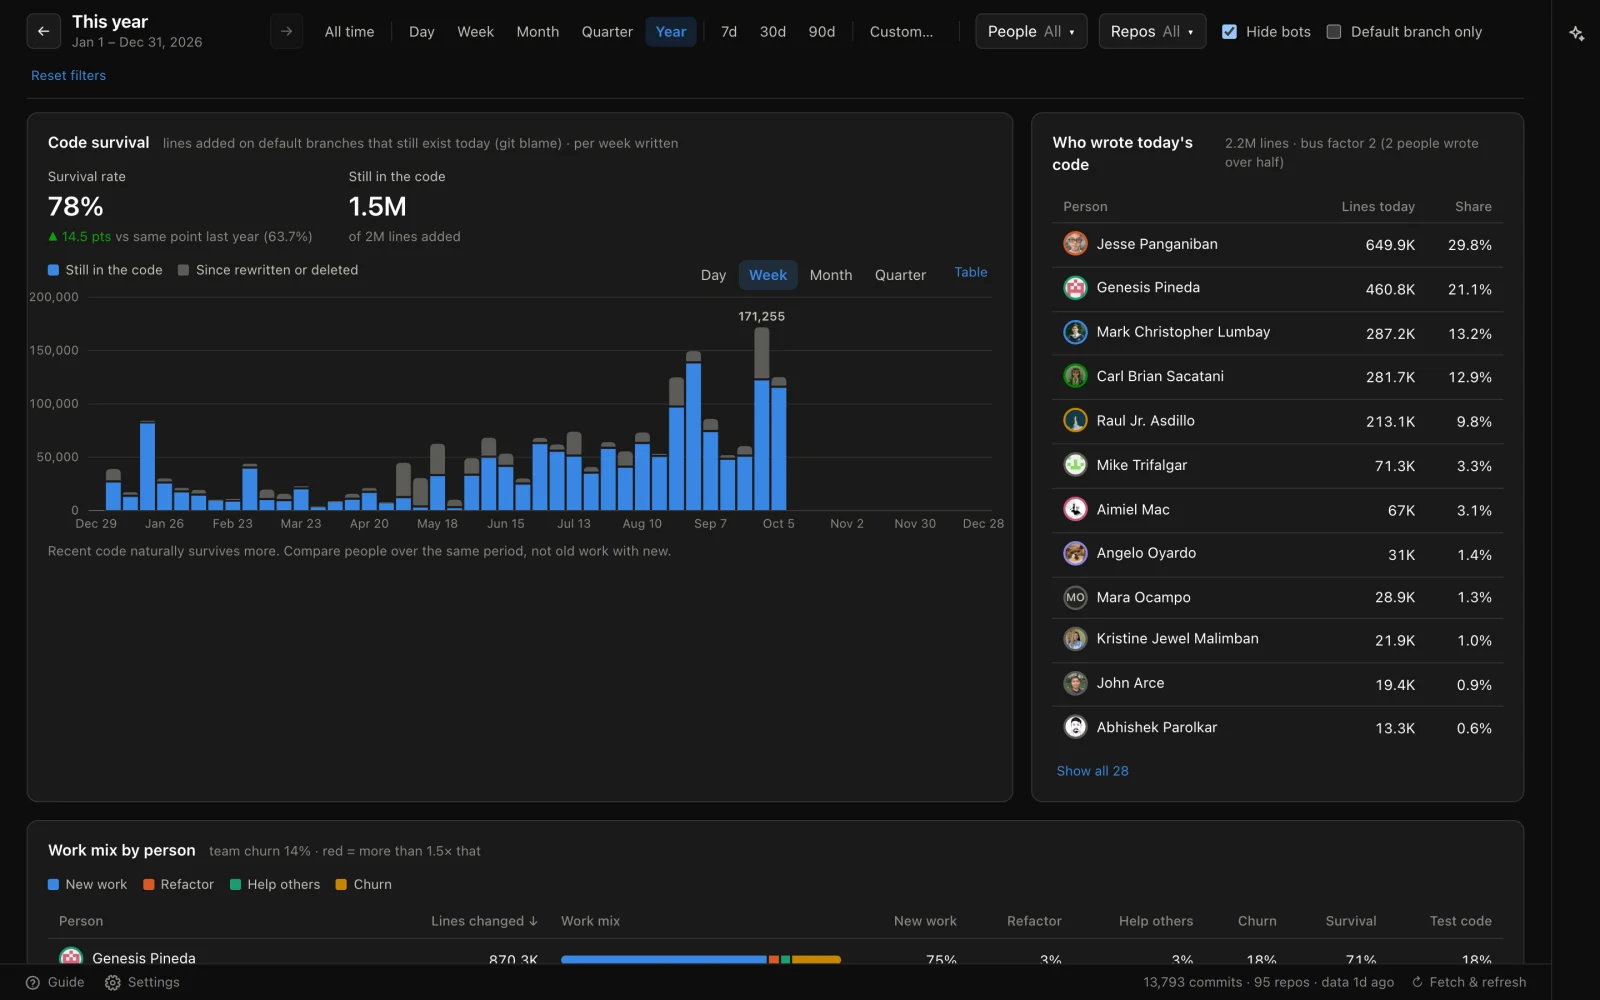
Survival is the share of the code someone added to the default branch that is still there today, taken from git blame. Pulse groups it by when the code was written, so recent work isn’t unfairly compared with code that has had years to be replaced.
It also shows who wrote today’s code, and the bus factor: the fewest people who together wrote more than half of it. A repository with a bus factor of one is flagged.
Pull requests
- Where the time goes: each pull request split into coding, waiting for a first review, and in review. The wait for a first review is usually where work stalls.
- Open now, oldest first, with anything waiting more than a week in red.
- Reviewers: who approves, who asks for changes, and how quickly each responds.
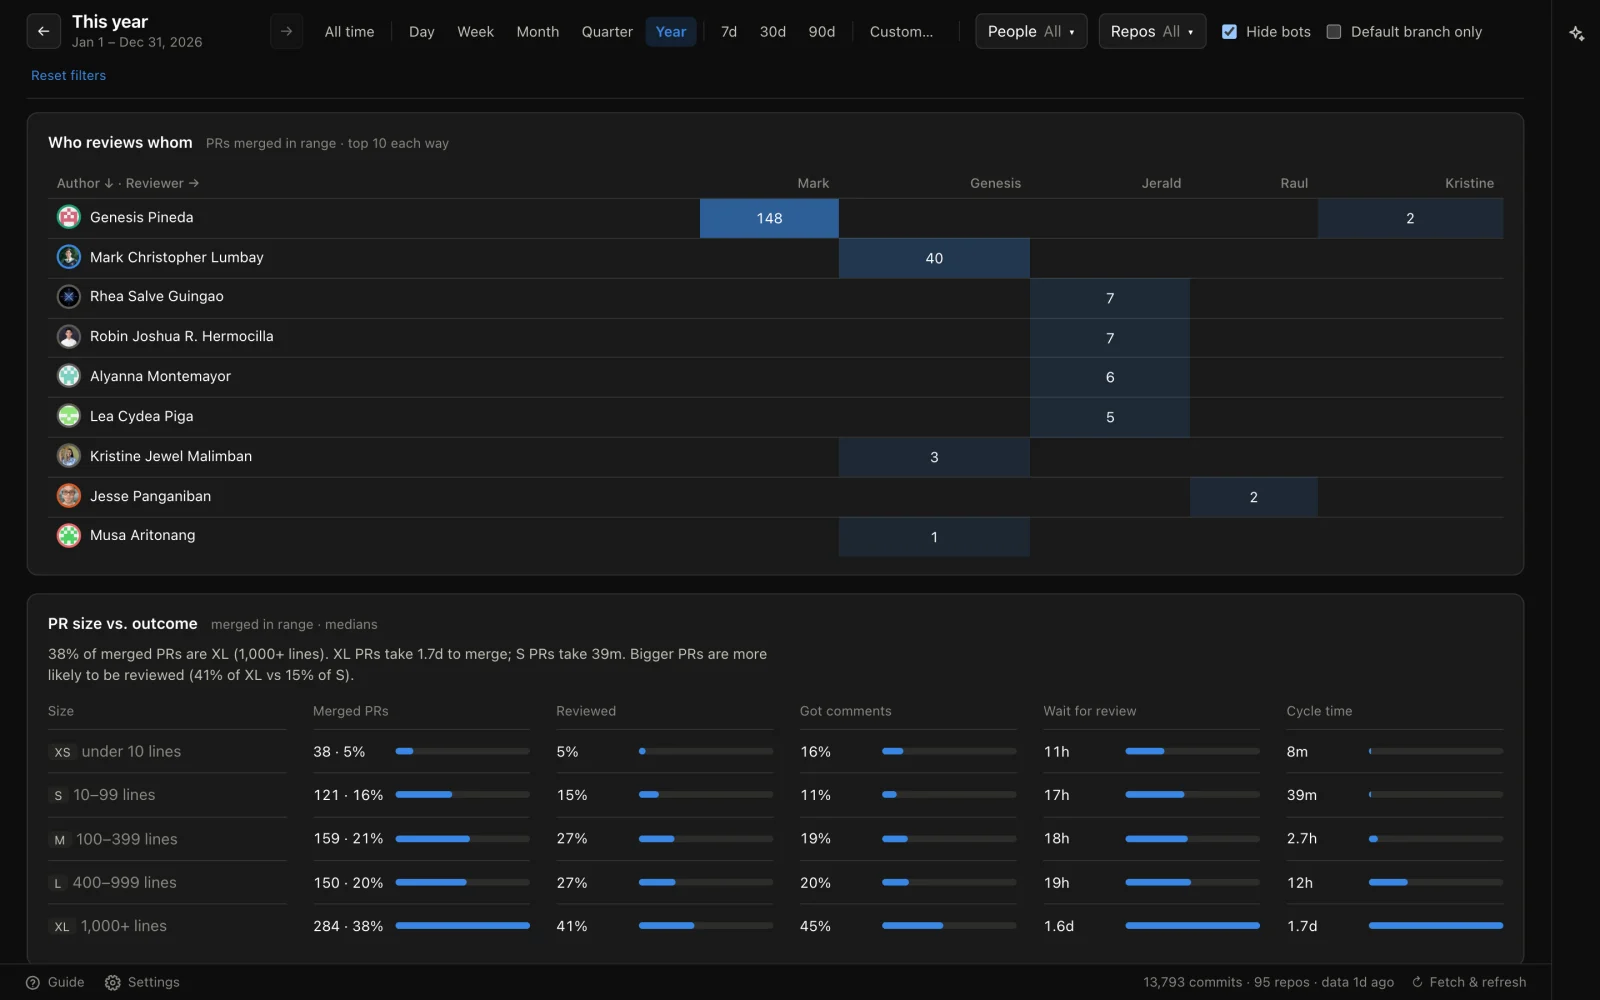
- Who reviews whom: a grid of authors against reviewers, so you can see who carries the reviewing and who never gets reviewed.
- Size against outcome: how review rates and merge times change from tiny pull requests to very large ones, with a plain sentence saying what that means for your team.
A guide to reading it fairly
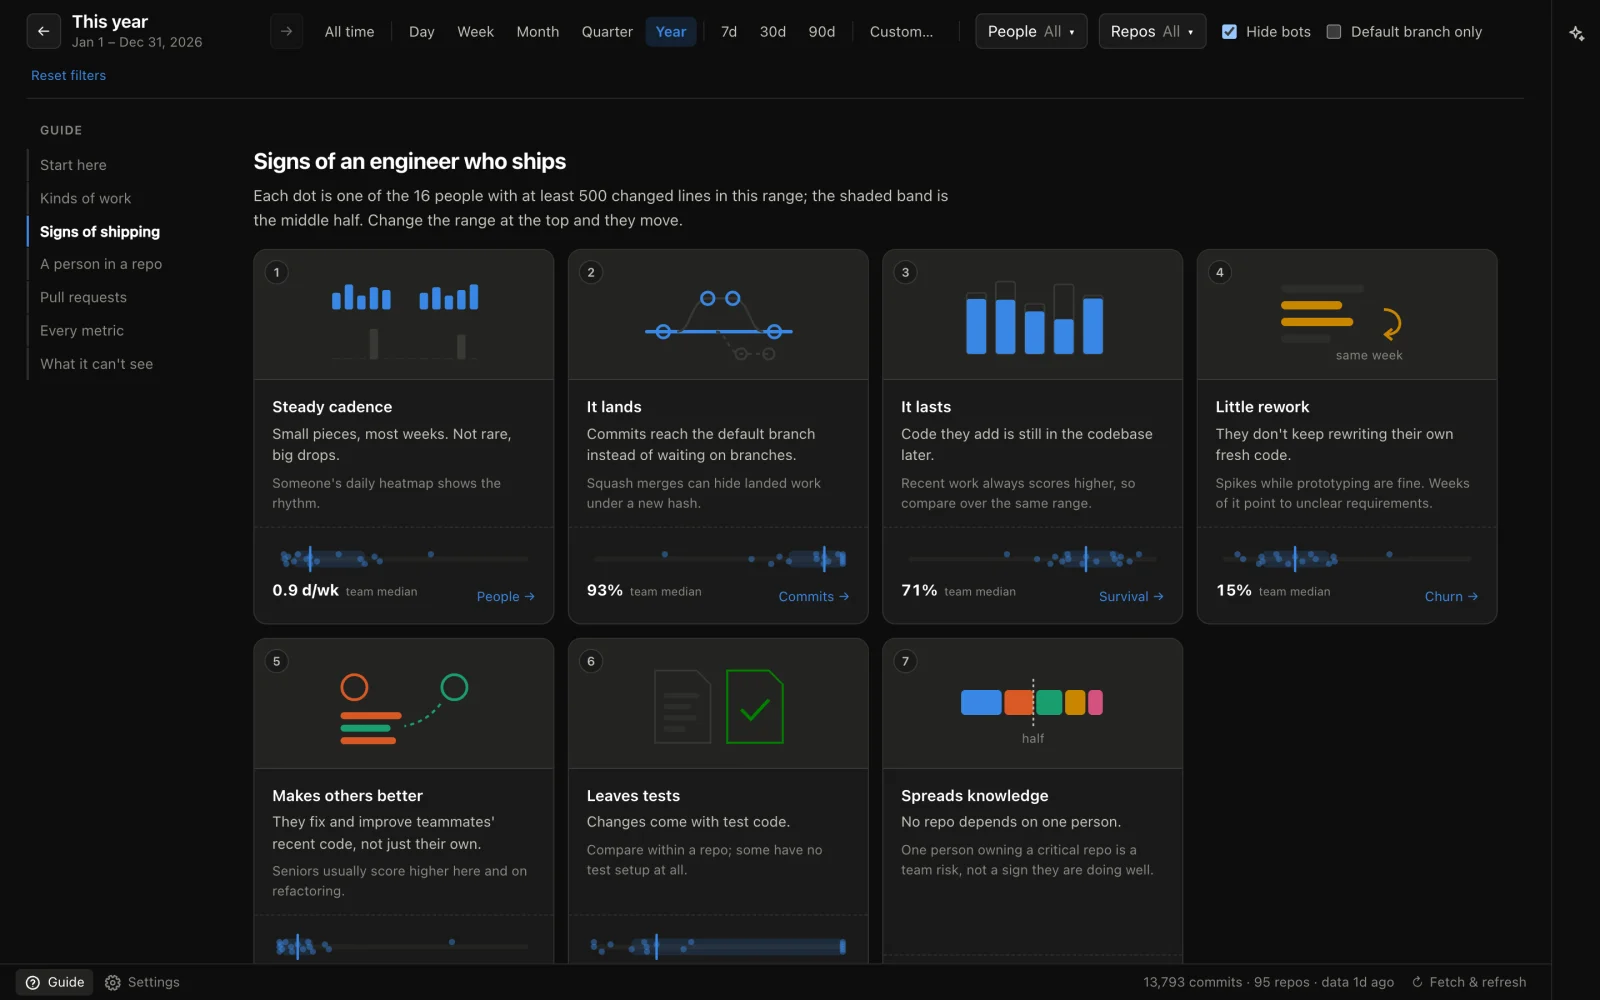
The numbers are easy to misuse, so Pulse comes with a guide. It opens with the rule I follow: read the numbers, then talk to the people. It describes seven signs of an engineer who ships, each with a strip showing where your own team sits, and it is clear about what git can’t tell you. Every metric has a short explanation where it appears, along with the typical range for your team. I treat the numbers as a signal, not a score, and I’d suggest you do the same.
Getting around
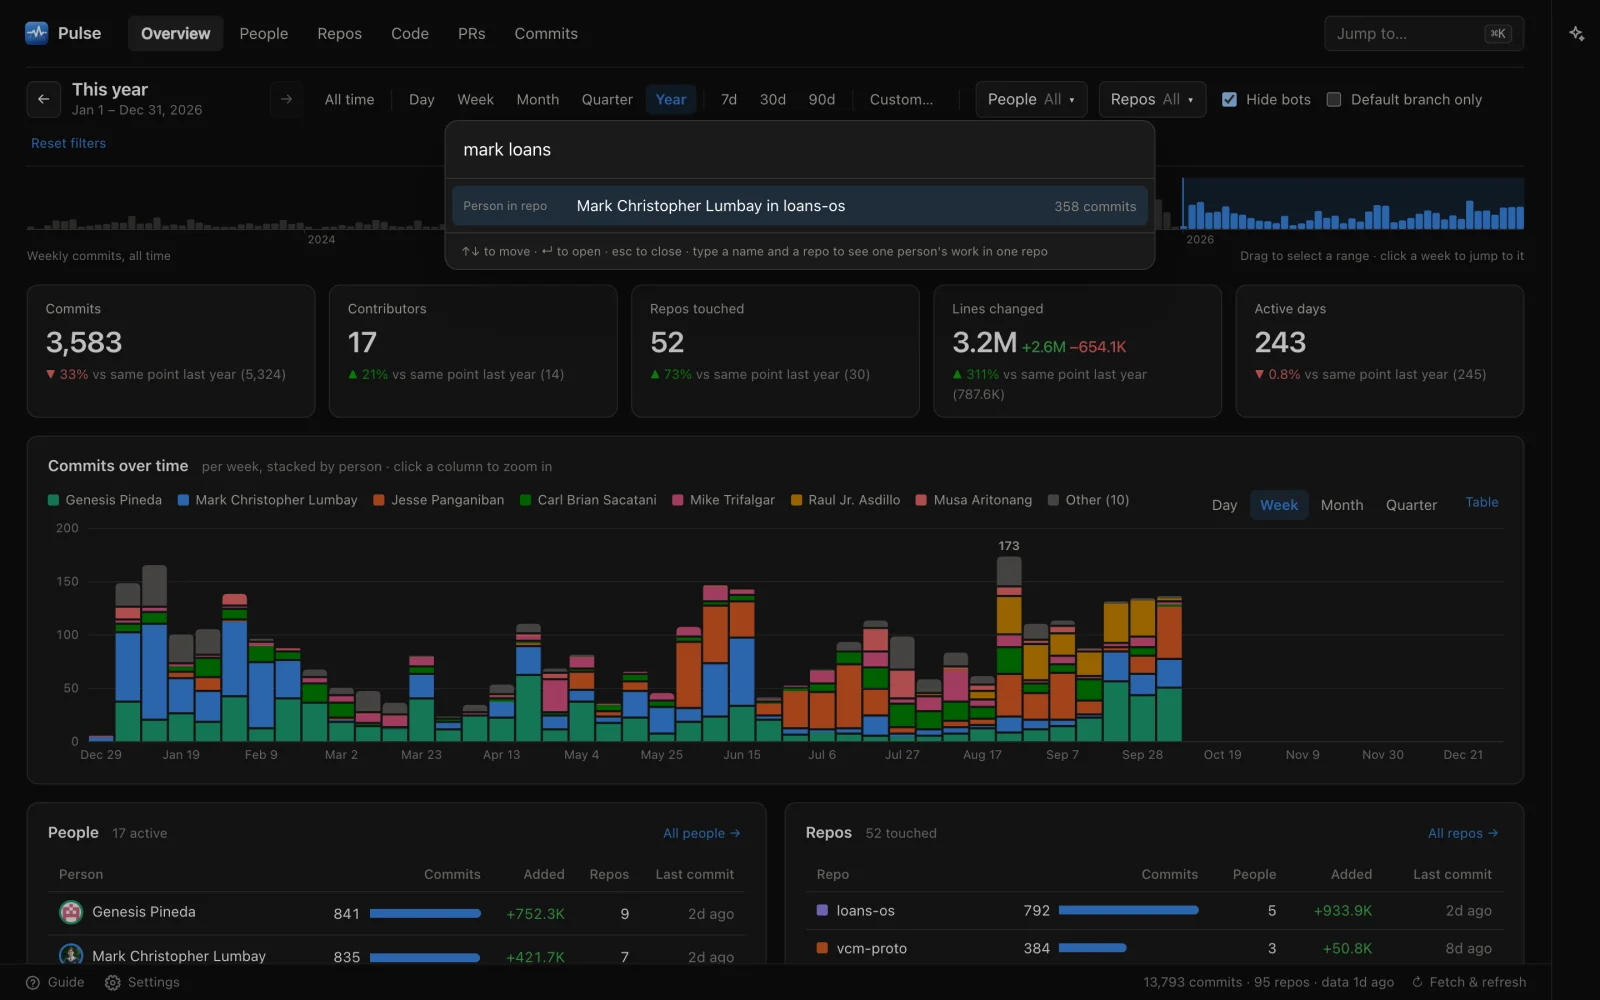
- Press ⌘K (Ctrl+K on Windows) and type a name, a repository, or both. “mark loans” opens one person’s work in one repository, next to everyone else’s.
- Drag across the timeline to pick a range, click any column to zoom into it, and use the arrow keys to step back and forward.
- Every view is a link, filters included, so you can send someone exactly what you’re looking at.
- Search every commit by message, hash, repository or person, and open any commit to read its diff straight from your clone.
Ask it questions
An agent panel lets you ask about the data in plain language, using Claude Code or Codex with your own sign-in. It reads the same numbers you see, through read-only tools, knows which page and range you’re looking at, and links its answers back to pages in Pulse. It asks before changing anything in your files, your repositories or on GitHub.
Getting started
On first launch Pulse walks you through three steps: sign in to GitHub with the GitHub CLI, pick one or more organisations, then pick repositories. It uses clones you already have and only downloads the ones that are missing. Before it starts, it shows how much it will download and how much disk space that leaves.
The first read of a folder takes about 30 seconds for a hundred repositories. Pull requests then sync in the background. Opening the folder again later is instant, and Fetch and refresh also picks up repositories created since.
People often commit under more than one name or email. Pulse merges them automatically, and you can rename someone, merge or split their identities, or mark an account as a bot. You can also leave repositories out without deleting them.
Your data stays on your computer
Pulse reads your local clones and talks to GitHub with your own login. Everything it works out is kept in a hidden .pulse folder on your computer. Nothing is sent to me or to Sageware.
Requirements
- A Mac with Apple Silicon, or a 64-bit Windows PC
- Git and the GitHub CLI. If either is missing, Pulse installs it for you: with Homebrew on a Mac, and with winget on Windows
- A GitHub account with access to the repositories you want to look at
The Windows installer isn’t code-signed yet, so the first time you run it Windows warns that it’s from an unknown publisher. Choose More info, then Run anyway.
Created by
 Jesse PanganibanCEO, Co-Founder